
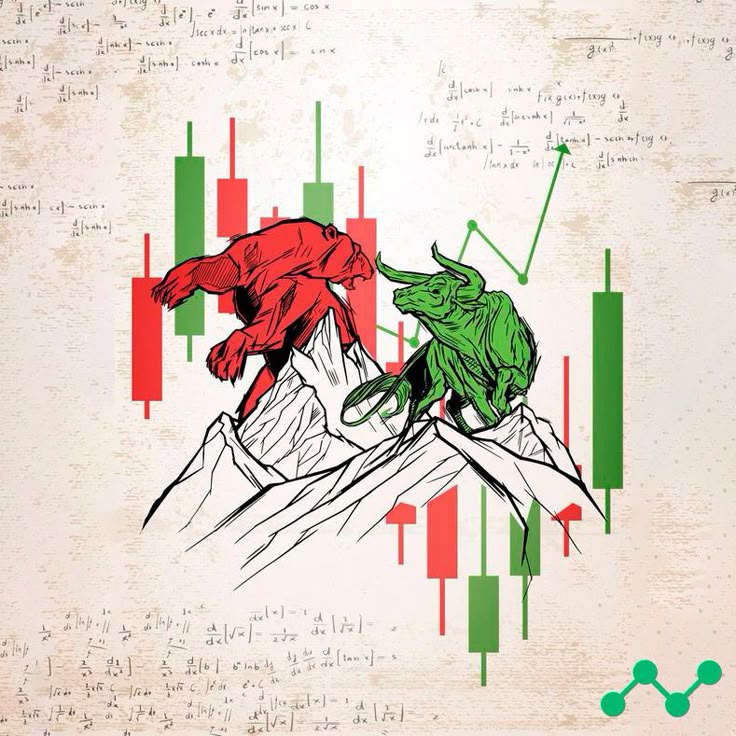
Your portfolio is like your playlist – every addition should have a purpose, and sometimes you need to skip the songs that no longer vibe with your goals.
Picture this: You've been investing for a while now, watching your portfolio grow (hopefully!), but lately, you've been wondering – are these stocks actually worth holding? Are you backing the right horses, or are some of your picks just taking up space like that one friend who never pays for dinner?
If you've ever stared at your portfolio and felt this uncertainty, you're not alone. Today, we're breaking down the essential indicators that separate portfolio winners from dead weight, without the jargon that makes your head spin.
The Smart Money Trail: Following FII and DII Holdings
Before diving into complex ratios, let's start with something simpler – who else is betting on your stocks? Foreign Institutional Investors (FII) and Domestic Institutional Investors (DII) are the big players with teams of analysts, research budgets, and serious skin in the game.
What to Look For:
- Increasing FII/DII Holdings: When these institutional investors increase their stake quarter after quarter, it's like getting a thumbs up from the pros
- Consistent Institutional Interest: Steady or growing institutional holding over multiple quarters indicates long-term confidence
- Red Flag Alert: If you see institutional investors consistently reducing their holdings, it might be time to investigate why
The Sweet Spot: Look for stocks where institutional holdings are between 15-40%. Too little might mean lack of confidence, too much could limit growth potential due to reduced liquidity.
PE Ratio: The Price Tag Reality Check
The Price-to-Earnings (PE) ratio is like checking if you're paying ₹500 for a ₹200 shirt – it tells you if a stock is reasonably priced compared to its earnings.
PE Ratio = Current Share Price ÷ Earnings Per Share
What Makes a Good PE Ratio?
- 15-25: Generally considered reasonable for most established companies
- Below 15: Could be undervalued (or there might be underlying issues)
- Above 25: Might be overvalued (or have exceptional growth prospects)
Pro Tip: Don't just look at the number in isolation. Compare it with:
- Industry average PE ratios
- The company's historical PE range
- Growth rate (PEG ratio = PE ÷ Growth Rate should ideally be under 1)
The Profitability Health Check: Key Ratios That Matter
Return on Equity (ROE)
This shows how efficiently a company uses shareholders' money to generate profits.
Good ROE: Above 15% consistently Excellent ROE: Above 20% Red Flag: Declining ROE trend over multiple years
Debt-to-Equity Ratio
Nobody likes a friend who's always borrowing money, and the same goes for companies.
Healthy Range: Below 0.5 (50% debt relative to equity) Caution Zone: 0.5 to 1.0 Danger Zone: Above 1.0 (unless it's a capital-intensive industry like infrastructure)
Current Ratio
Can the company pay its short-term bills? This ratio answers that question.
Ideal Range: 1.5 to 3 Below 1: Potential liquidity issues Above 3: Might be holding too much cash (not always bad, but could indicate lack of growth opportunities)
Revenue Growth: The Momentum Indicator
Look for companies showing consistent revenue growth over the past 3-5 years. Here's what to watch:
Strong Growth: 15%+ annually Steady Growth: 8-15% annually Concern: Below 5% or highly volatile year-over-year
Bonus Points: Companies that maintain growth even during economic downturns often have stronger business models.
Promoter Holdings: Skin in the Game
When company founders and promoters hold a significant stake, they're more likely to make decisions that benefit long-term shareholders.
Ideal Range: 40-60% Too Low: Below 25% might indicate lack of confidence Too High: Above 75% might limit liquidity and transparency
The Portfolio Audit: Your Action Plan
Step 1: The 5-Minute Health Check For each stock in your portfolio, quickly note:
- Current PE ratio vs industry average
- FII/DII holding trend (increasing/decreasing)
- Latest quarterly revenue growth
- Debt-to-equity ratio
Step 2: The Red Flag Screening Consider reducing or exiting positions if you find:
- Consistently declining institutional holdings
- PE ratio significantly higher than industry average without justification
- Debt-to-equity above 1.0 (unless industry-specific)
- Negative revenue growth for 2+ consecutive quarters
Step 3: The Opportunity Scanning Look for stocks with:
- Increasing institutional interest
- Reasonable PE ratios (15-25) with strong growth prospects
- Consistent revenue growth above 10%
- Strong ROE above 15%
Beyond the Numbers: The Qualitative Edge
While ratios and holdings are crucial, don't ignore the story behind the numbers:
- Management Quality: Are the leaders transparent and shareholder-friendly?
- Business Moat: Does the company have sustainable competitive advantages?
- Industry Tailwinds: Is the sector poised for growth?
- Regulatory Environment: Are there upcoming policy changes that could impact the business?
The Trackk Advantage: Making Smart Decisions Easier
At Trackk, we believe investing shouldn't feel like solving a puzzle blindfolded. Our AI-powered insights combined with human analyst verification help you identify these patterns without spending hours on research. We translate complex financial data into clear, actionable insights that help you make confident investment decisions.
Your Next Move
Your portfolio is a reflection of your financial goals and risk appetite. The right stocks for you might not be right for someone else, but the fundamentals of good investing remain constant – focus on quality companies with strong financials, reasonable valuations, and clear growth prospects.
Remember, portfolio management is not about timing the market perfectly; it's about holding quality stocks for the right duration and making informed decisions based on solid analysis.
Ready to give your portfolio the health check it deserves? Start with one or two stocks, apply these indicators, and gradually work through your entire portfolio. Your future self will thank you for the discipline you show today.
Want personalized insights on your portfolio holdings? Trackk's AI-powered analysis can help you identify opportunities and red flags in your current investments. Because when it comes to your money, you deserve clarity, not confusion.